
The data in this experiment was provided by 69 Facebook users, with the collection area concentrated in the Greater Taipei region (my social circle), gathering check-in data from 2010/8/25 to 2012/4/30. The following charts describe the characteristics of this dataset:
Table 1: Quantity of Various Data Collected
| Item | Quantity |
| Number of Participants | 69 |
| Number of Users | 25184 |
| Number of Users Who Have Checked In | 7395 |
| Number of Locations | 37305 |
| Number of Check-ins | 74283 |
| Number of Users Who Have Checked In to Restaurants | 3928 |
| Number of Restaurants | 2691 |
| Number of Check-ins to Restaurants | 8264 |
Table 2: Ratios of Various Data Collected
| Item | Ratio | |
| Participant Gender Ratio (Male/Female) | 1.16 | 37 / 32 |
| User Gender Ratio (Male/Female) | 1.13 | 13309 / 11763 |
| Gender Ratio of Users Who Have Checked In to Restaurants (Male/Female) | 0.87 | 1825 / 2088 |
| Ratio of Users Who Have Checked In to Restaurants | 15.60% | 3928 / 25184 |
| Ratio of Locations Classified as Restaurants | 7.21% | 2691 / 37305 |
| Ratio of Check-ins to Restaurants | 11.13% | 8264 / 74283 |
| Ratio of Users with Public Age | 60.40% | 15212 / 25184 |
| Ratio of Users with Public Gender | 99.56% | 25072 / 25184 |
| Ratio of Users with Public Hometown | 30.90% | 7782 / 25184 |
| Ratio of Users with Public Company | 47.10% | 11861 / 25184 |
| Ratio of Users with Public School | 80.12% | 20178 / 25184 |
| Ratio of Users with Public Family | 60.83% | 15319 / 25184 |
| Ratio of Users with Public Partner | 15.90% | 4003 / 25184 |
| Ratio of Restaurant Check-ins in the Greater Taipei Region | 67.81% | 5604 / 8264 |
| Ratio of Restaurants in the Greater Taipei Region | 48.94% | 1317 / 2691 |
| Ratio of Users Who Have Checked In to Restaurants in the Greater Taipei Region | 69.27% | 2721 / 3928 |
Figure 1: Distribution Map of All Collected Restaurants
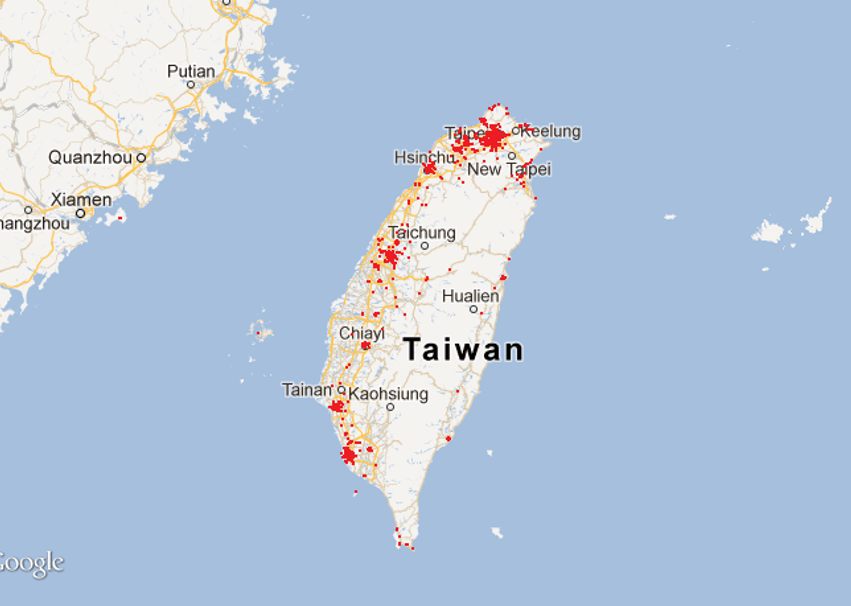
Table 3: Mean, Median, and Standard Deviation of Various Data Collected
| Item | Mean | Median | Standard Deviation | Maximum | Minimum | |
| Number of Friends of Participants | 504.01 | 423 | 346.48 | 2200 | 34 | n=69 |
| Age of Participants | 23.28 | 22 | 4.99 | 49 | 18 | n=69 |
| Age of Users | 23.52 | 22 | 5.87 | 107 | 13 | n=25184 |
| Age of Users Who Have Checked In to Restaurants | 22.99 | 22 | 4.17 | 106 | 15 | n=3928 |
| Number of Check-ins to Restaurants by Users | 0.34 | 0 | 0.99 | 12 | 0 | n=25184 |
| Number of Restaurants Checked In by Users | 0.33 | 0 | 0.93 | 10 | 0 | n=25184 |
| Number of Times Restaurants Were Checked In | 3.23 | 2 | 6.31 | 224 | 1 | n=2691 |
| Number of Check-ins to Restaurants by Users Who Have Checked In to Restaurants | 2.21 | 2 | 1.48 | 12 | 1 | n=3928 |
| Number of Restaurants Checked In by Users Who Have Checked In to Restaurants | 2.10 | 2 | 1.35 | 10 | 1 | n=3928 |
| Number of Times Restaurants Checked In by Restaurant Check-ins | 1.05 | 1 | 0.29 | 10 | 1 | n=8264 |
| Age of Check-in Users for Restaurant Check-ins | 22.96 | 22 | 3.97 | 106 | 15 | n=8264 |
| Average Age of Companions for Restaurant Check-ins | 23.55 | 23 | 3.91 | 107 | 16 | n=8264 |
| Companion Gender Indicator for Restaurant Check-ins (Female/Total) | 0.56 | 1 | 0.48 | 1 | 0 | n=8264 |
| Number of Companions for Restaurant Check-ins | 2.76 | 2 | 2.43 | 42 | 1 | n=8264 |
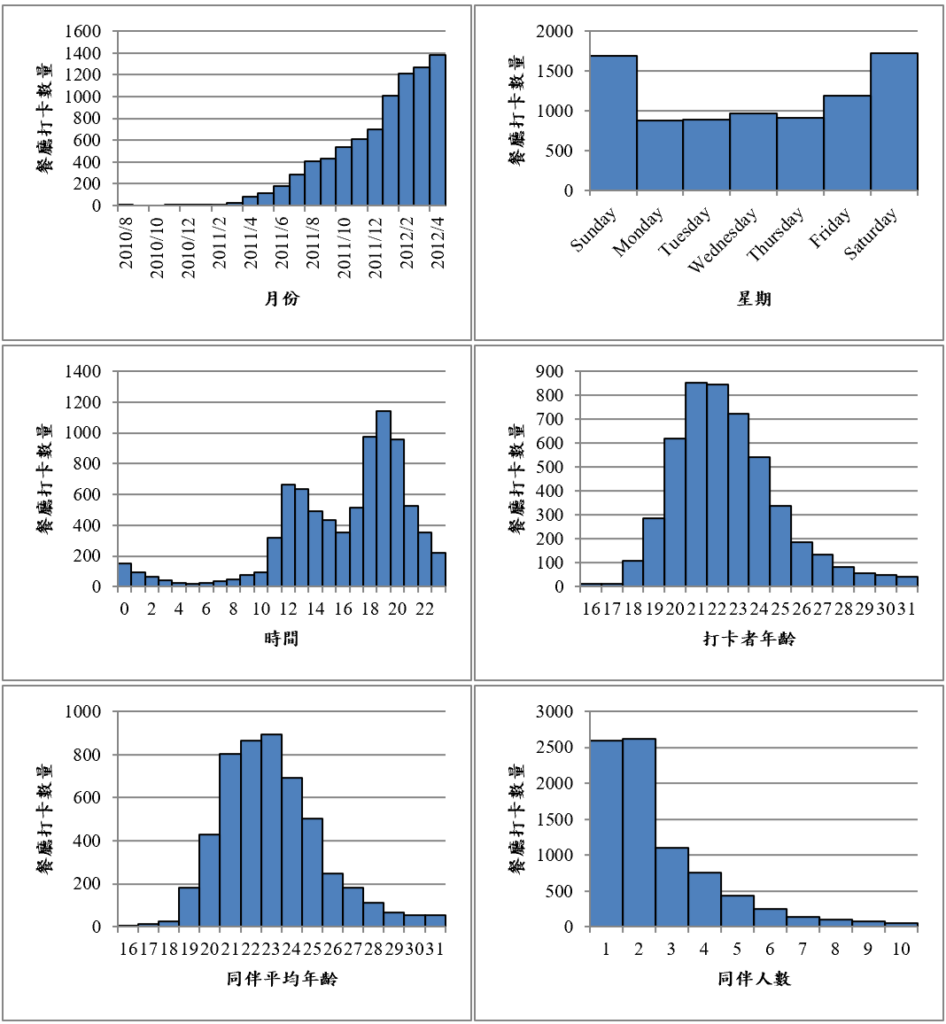
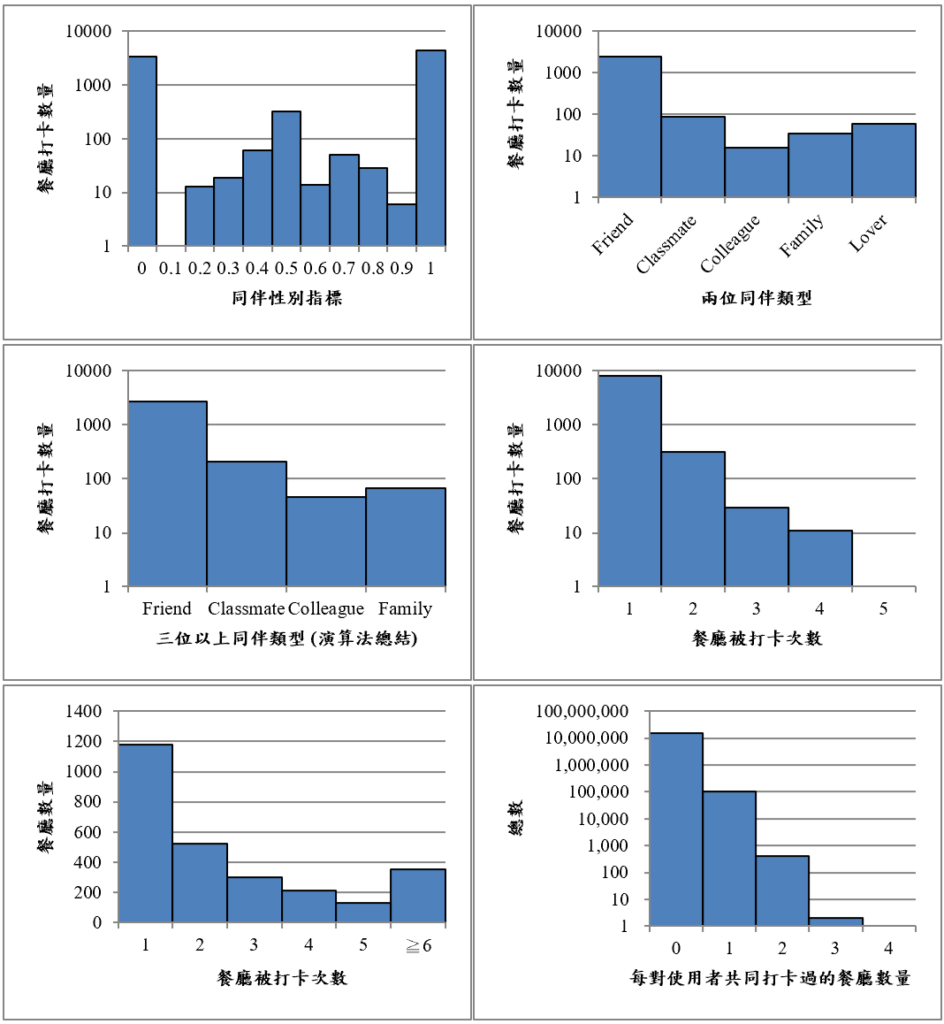
Figure 2: Statistics of Collected Restaurant Check-in Data
This dataset exhibits many important phenomena, for example:
- 1 participant can bring approximately 365 users’ data (Number of Users Collected / Number of Participants), as shown in Table 1.
- 1 out of every 7 people has checked in to a restaurant, 1 out of every 14 locations is a restaurant, 1 out of every 9 check-ins is at a restaurant, and women are more enthusiastic about restaurant check-ins than men; the ratio of users with public hometowns is too low, as shown in Table 2.
- Most check-ins and restaurants are concentrated in the Greater Taipei region, as shown in Figure 1.
- Participants have an average of 504 friends, and the average age of all users is approximately 24 years old; each person checks in to restaurants an average of 0.34 times, checks in to an average of 0.33 restaurants, and each restaurant is checked in approximately 3 times on average; people who have checked in to restaurants check in to restaurants an average of approximately 2 times and check in to an average of approximately 2 restaurants; restaurant check-ins have an average of approximately 3 companions, with an average age of approximately 24 years old, and a slightly higher ratio of women, as shown in Table 3.
- Most restaurant check-ins occur within the last half year, with significantly more on weekends, peaks during lunch and dinner times, a peak in check-in user age at 21 years old, a peak in companion age at 23 years old, frequent companionship, an even distribution of companion genders, and friend counts being more than 10 times that of other types; most restaurants are checked in only once, and similar users mostly share only 1 commonly checked-in restaurant, as shown in Figure 2.
If this dataset is converted into a binary matrix of users and restaurants, this matrix has 3928 rows (Number of Users Who Have Checked In to Restaurants) and 2691 columns (Number of Restaurants). If sparsity is defined as nonzero/total, the sparsity of this dataset is 0.00078.


