
On an i7-11700 with an RTX 5060 Ti 16GB and 64 GiB RAM, nine-run Decode medians were 65.55, 51.30 and 42.45 tokens/s for IQ2_XS, IQ3_XXS and IQ3_S respectively. This article compares all three across Prefill/Decode, individual runs, author results and estimated inference time, LiveCodeBench scores, download size, RAM usage and remaining capacity. The IQ2_XS speed tests use Swift 1.5; both IQ3 tests use original Qwen. Quality scores for original quantizations are identified separately.
Strata series: Model benchmarks · Performance formula · Upgrade costs and benefits
All three models: nine-run benchmark overview
The tables below and the author comparison use one consistent baseline: IQ2_XS/IQ3_XXS were tested on October 11, 2026 with Strata 0.1.41; IQ3_S was tested on October 15 with 0.1.43.1. Each model has nine nominal 32K Prefill runs and nine nominal 4K Decode runs, totaling 54 engine runs. The newer IQ3_XXS retest is reported separately and is not mixed into these medians.
| Model | Prefill median | Prefill range | Decode median | Decode range |
|---|---|---|---|---|
| IQ2_XS (Swift 1.5) | 1,622.10 | 1,600.68–1,627.45 | 65.55 | 61.08–66.93 |
| IQ3_XXS | 1,666.44 | 1,648.03–1,667.46 | 51.30 | 50.78–53.42 |
| IQ3_S | 1,626.96 | 1,581.32–1,641.58 | 42.45 | 41.07–43.03 |
| Item | IQ2_XS | IQ3_XXS | IQ3_S |
|---|---|---|---|
| Model variant | Swift 1.5 | Original Qwen | Original Qwen |
| Test date | 2026-10-11 | 2026-10-11 | 2026-10-15 |
| Strata | 0.1.41 | 0.1.41 | 0.1.43.1 |
| NVIDIA driver | 591.86 | 591.86 | 610.88 |
| KV streaming | On; resident 32,768 | On; resident 32,768 | Off; selected by setup based on RAM |
All three use the same PC, saved substitute source-code prompts and token IDs—not the author’s unpublished original text. Nominal 32K/4K prompts contain 31,566/3,562 tokens; timed Prefill covers 31,565/3,561, with the final prompt token handled by the first Decode step. Each run generates 256 tokens greedily, with a 65,536-token context, INT8 KV, MTP spec 4 / min-p 0.5, automatic expert cache and Prefill, and a 1,500 MiB VRAM reserve.
HTTP and vision services were stopped during benchmarking. Each sample used a fresh engine process, no prompt-cache reuse, and no OS file-cache flush. Model loading is excluded from timing. Each older nine-run set combines the original three runs with six additional runs; IQ3_S has nine new runs. No slower samples were discarded. Row N means each model’s Nth run, not simultaneous or interleaved testing. Variant, KV and driver differences are listed above, so this comparison reflects actual configurations rather than isolating quantization alone.
| Run | IQ2_XS (Swift 1.5) | IQ3_XXS | IQ3_S |
|---|---|---|---|
| 1 | 1,600.68 | 1,648.03 | 1,626.22 |
| 2 | 1,619.99 | 1,652.45 | 1,581.32 |
| 3 | 1,620.37 | 1,667.16 | 1,603.99 |
| 4 | 1,623.67 | 1,666.63 | 1,626.96 |
| 5 | 1,622.78 | 1,667.46 | 1,621.56 |
| 6 | 1,627.45 | 1,667.13 | 1,637.45 |
| 7 | 1,622.76 | 1,665.17 | 1,641.58 |
| 8 | 1,607.08 | 1,666.44 | 1,637.69 |
| 9 | 1,622.10 | 1,664.15 | 1,639.34 |
| Run | IQ2_XS (Swift 1.5) | IQ3_XXS | IQ3_S |
|---|---|---|---|
| 1 | 61.08 | 51.54 | 41.89 |
| 2 | 64.07 | 50.85 | 42.10 |
| 3 | 64.78 | 50.78 | 42.44 |
| 4 | 66.18 | 51.01 | 42.45 |
| 5 | 65.55 | 51.20 | 41.07 |
| 6 | 66.92 | 51.63 | 42.73 |
| 7 | 63.27 | 51.30 | 42.60 |
| 8 | 66.93 | 53.42 | 43.03 |
| 9 | 66.93 | 51.57 | 42.77 |
Version retests and data coverage
| Model | 0.1.41 | 0.1.43.1 | New-version speed change |
|---|---|---|---|
| IQ2_XS (Swift 1.5) | 1,622.10 / 65.55 | Not tested | No matched version pair |
| IQ3_XXS | 1,666.44 / 51.30 | 1,665.73 / 51.65 | Prefill −0.04%; Decode +0.68% |
| IQ3_S | Not tested | 1,626.96 / 42.45 | No matched version pair |
Only IQ3_XXS has nine-run tests for both versions. Its 0.1.43.1 figures come from the valid October 13, 2026 retest; invalidated batches are excluded. Those individual results are retained below. The author comparison and v4 prediction formula continue to use the 0.1.41 IQ3_XXS baseline.
| Run | Prefill / 32K | Decode / 4K |
|---|---|---|
| 1 | 1,672.80 | 51.65 |
| 2 | 1,672.26 | 51.65 |
| 3 | 1,665.73 | 51.23 |
| 4 | 1,667.96 | 51.50 |
| 5 | 1,642.28 | 51.75 |
| 6 | 1,655.38 | 51.24 |
| 7 | 1,655.48 | 51.77 |
| 8 | 1,669.69 | 52.43 |
| 9 | 1,655.81 | 51.77 |
Same-model comparison: local PC versus Strata author
| Item | Local PC | Strata author |
|---|---|---|
| CPU | Intel Core i7-11700 | AMD Ryzen 5 7600 |
| GPU | RTX 5060 Ti 16GB | RTX 5070 12GB |
| GPU link | PCIe 4.0 ×8 | PCIe 5.0 ×16 |
| RAM | 64GB DDR4-3200, dual channel | 64GB DDR5-5200, channel configuration unconfirmed |
Both IQ2_XS results use Swift 1.5; IQ3_XXS and IQ3_S use original Qwen on both PCs. Local IQ2_XS / IQ3_XXS figures retain the nine-run medians from October 11, 2026, on Strata 0.1.41. IQ3_S uses the October 15 nine-run medians on Strata 0.1.43.1. Each author result is a single measurement. Times below are calculated for 51,200 input + 4,096 output tokens.
| Model / metric | Local speed | Author speed | Author speed increase | Local seconds | Author seconds | Author time saved |
|---|---|---|---|---|---|---|
| Swift IQ2_XS / Prefill | 1,622.10 | 2,092.02 | +29.0% | 31.6 | 24.5 | 22.5% |
| Swift IQ2_XS / Decode | 65.55 | 78.60 | +19.9% | 62.5 | 52.1 | 16.6% |
| Swift IQ2_XS / Total | — | — | — | 94.1 | 76.6 | 18.6% |
| Original IQ3_XXS / Prefill | 1,666.44 | 1,745.16 | +4.7% | 30.7 | 29.3 | 4.5% |
| Original IQ3_XXS / Decode | 51.30 | 61.64 | +20.2% | 79.8 | 66.5 | 16.8% |
| Original IQ3_XXS / Total | — | — | — | 110.6 | 95.8 | 13.4% |
| Original IQ3_S / Prefill | 1,626.96 | 1,624.07 | −0.2% | 31.5 | 31.5 | −0.2% |
| Original IQ3_S / Decode | 42.45 | 53.30 | +25.6% | 96.5 | 76.8 | 20.4% |
| Original IQ3_S / Total | — | — | — | 128.0 | 108.4 | 15.3% |
Time saved = 1 − author time / local time. Speed increase = author tokens/s / local tokens/s − 1. Both use unrounded values. These are calculated model inference times, not measured end-to-end coding-agent task times.
The author used Strata 0.1.26 with an English MTP vocabulary; the local tests used 0.1.41 / 0.1.43.1 with a CJK MTP vocabulary. Prompts, context and KV conditions also differed, so the gap cannot be attributed entirely to hardware or quantization. Locally, original IQ3_XXS Prefill was 2.7% faster and Decode 21.7% slower than Swift IQ2_XS, changing both the model variant and quantization. IQ3_S also differs in KV settings and driver version, as noted above. Negative author speed-increase or time-saved percentages mean the author’s result was slower.
ISTA-DASLab original quantizations: full quality results
These are the complete quality metrics published in ISTA-DASLab’s original GSQ-RCO model card, checked on October 15, 2026. IQ2_XS, IQ3_XXS and IQ3_S are shown alongside Q2_0 and the BF16 baseline. Swift 1.5 is excluded. These are published results, not quality tests rerun locally in Strata.
The IQ2_XS speed tests above use Swift 1.5; the scores and 68.0 GB download here describe ISTA’s original quantization. IQ3_XXS/IQ3_S speed and quality figures both refer to original quantizations, but their quality evaluations were not conducted in the local speed-test environment.
| Variant | AIME25 | GPQA-Diamond | LiveCodeBench v6 | Task avg |
|---|---|---|---|---|
| BF16 | 100.00 | 91.92 | 87.43 | 93.12 |
| Q2_0 | 96.67 | 89.39 | 81.14 | 89.07 |
| IQ2_XS | 96.67 | 87.37 | 83.43 | 89.16 |
| IQ3_XXS | 100.00 | 91.41 | 86.29 | 92.57 |
| IQ3_S | 100.00 | 92.93 | 86.86 | 93.26 |
AIME25 covers mathematical reasoning, GPQA-Diamond scientific questions, and LiveCodeBench v6 code generation. Task avg averages only these three benchmarks; it is neither an overall score across all tests nor a complete coding-agent task success rate.
| Variant | Average bpw | Download (GB) | ZS avg | recovery |
|---|---|---|---|---|
| BF16 | 16.00 | 354 | 76.94 | 100.0% |
| Q2_0 | 2.40 | 66.4 | 78.00 | 101.4% |
| IQ2_XS | 2.50 | 68.0 | 77.16 | 100.3% |
| IQ3_XXS | 3.00 | 75.8 | 77.23 | 100.4% |
| IQ3_S | 3.50 | 83.6 | Not published | Not published |
ZS avg averages five zero-shot tasks: ARC-Easy, ARC-Challenge, HellaSwag, WinoGrande and PIQA. recovery expresses ZS avg relative to BF16, not Task avg retention. The card does not publish these two values for IQ3_S or the five individual zero-shot task scores; no estimates are substituted.
bpw averages transformer-weight precision, excluding the fixed-precision n-gram shard. Download sizes include both shards and use decimal GB; they are not runtime RAM usage.
IQ3_XXS gains 2.86 LiveCodeBench points over IQ2_XS. IQ3_S adds 0.57 LiveCodeBench and 1.52 GPQA-Diamond points over IQ3_XXS for a 7.8 GB larger download. Its Task avg of 93.26 slightly exceeds BF16’s 93.12, while LiveCodeBench remains 0.57 points lower. ISTA attributes small above-baseline results to evaluation variance; they do not establish that quantization improves capability.
The chart retains the LiveCodeBench line and adds Task avg, the mean of AIME25, GPQA-Diamond and LiveCodeBench v6. Its vertical axis starts at 80 to highlight differences, and each metric has its own dashed BF16 baseline. Coder IQ1_M prunes 50% of experts and is shown separately: a 58.4 GB download and an 86.28 LiveCodeBench score. Its task average has not been published, so that point is omitted.
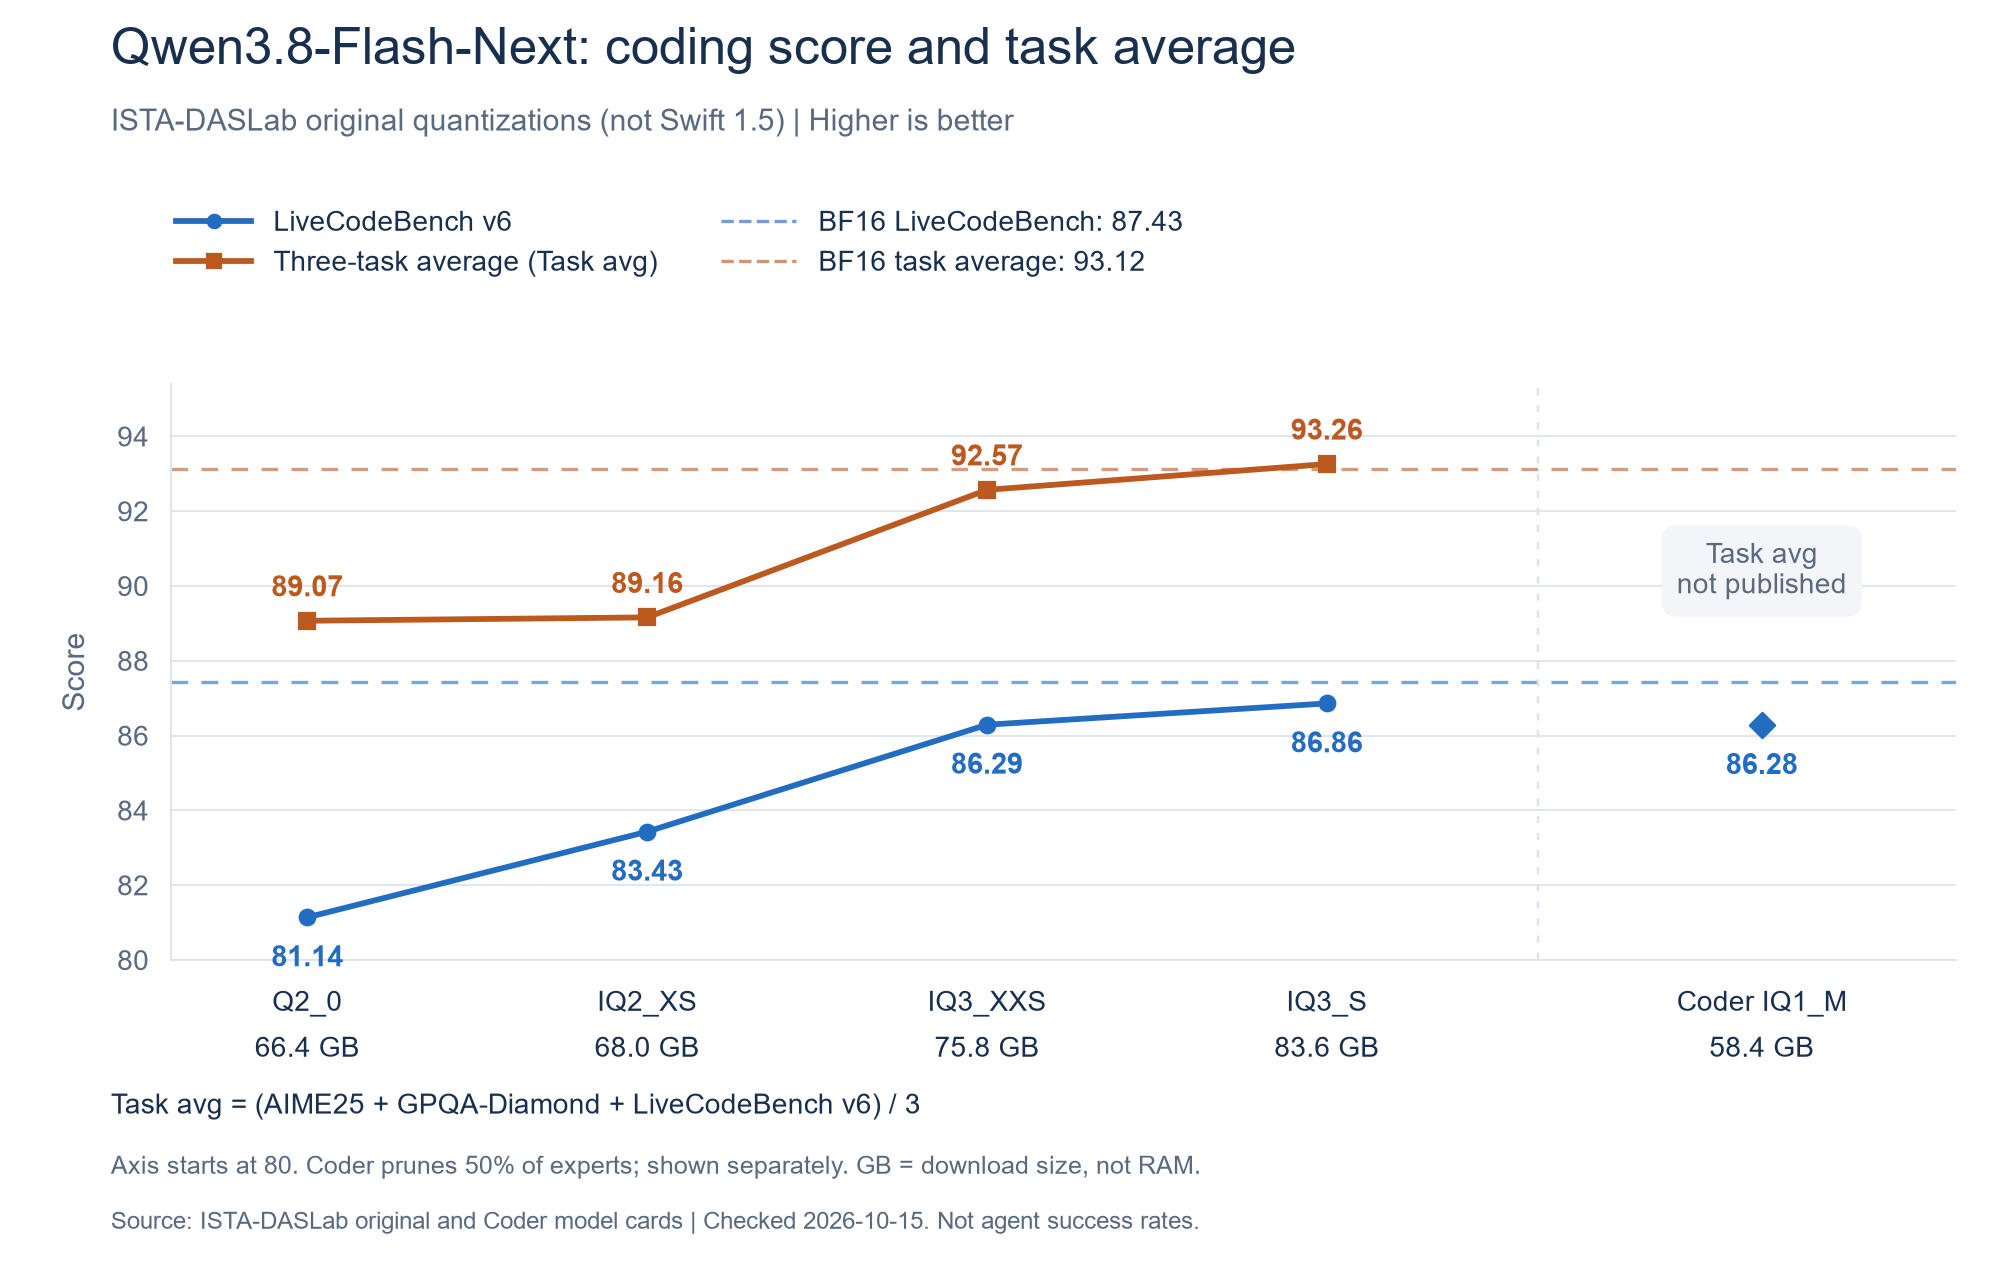
Sources: ISTA-DASLab full original-quantization results, model sizes and bpw definitions, and the Coder model card. The original model card does not report SWE-bench or complete coding-agent task success rates for these three quantizations; the scores above cannot substitute for them.
How much of 64 GiB RAM remains?
This PC has 64.00 GiB installed and 63.84 GiB usable by Windows. All three models are compared against that same capacity. This section uses GiB throughout; approximate memory budgets are not precise measurements.
| Item | IQ2_XS | IQ3_XXS | IQ3_S |
|---|---|---|---|
| Installed capacity | 64.00 | 64.00 | 64.00 |
| Total usable by Windows | 63.84 | 63.84 | 63.84 |
| Expert weights in RAM, approximately | 33.53 | 40.05 | 46.57 |
| Estimated total model RAM | 39.12 (official) | 45.63 (official) | 52.15 (article estimate) |
| Capacity remaining after estimate | 24.72 | 18.20 | 11.69 |
| Measured unload/reload increment, including vision | Not measured | 44.12 | Not measured |
| Capacity remaining after measured increment | Not measured | 19.72 | Not measured |
The IQ2_XS/IQ3_XXS total estimates follow the official expert-weights-plus-overhead figures. There is no equivalent official total for IQ3_S: this article adds the same approximately 5.59 GiB overhead to its officially stated expert size, giving 52.15 GiB. This is an inference, not an IQ3_S measurement or a directly published official total. The official IQ2_XS figure describes the original quantization; it is only a capacity guide for the similar Swift 1.5 architecture, which was not measured separately. The official decimal-GB estimates are converted to GiB; two decimal places aid comparison and do not imply measurement precision.
Remaining capacity still includes memory already used by Windows and other applications; it is not currently free RAM. The 44.12 GiB IQ3_XXS figure is the whole-system unload/reload difference measured on October 13, 2026 with a 65,536-token context and vision enabled. Caching and background activity affect it; it is not exclusive process memory. Official estimates and measurements are separate calculations, not cumulative deductions. Differences use unrounded values.
Definitions: Strata RAM estimates and expert weights and capacity requirements. Download size, system RAM and VRAM are different quantities; the RAM+VRAM column in MODELS must not be treated as system RAM alone.
Choosing between the three models
| Model | Priority it serves | Tradeoff |
|---|---|---|
| IQ2_XS | Faster answer generation and more RAM for development tools | Speed tests use Swift; original-model quality scores do not transfer directly |
| IQ3_XXS | Balance of original-model quality and remaining RAM | Slower generation; development tools still need memory headroom |
| IQ3_S | Highest LiveCodeBench score among these original quantizations | Slowest generation and least capacity left for other work on 64 GiB |
Original IQ3_XXS gains 2.86 LiveCodeBench points over original IQ2_XS; IQ3_S adds another 0.57. On this PC, their Prefill rates are close; the larger differences are Decode speed and RAM budget. These scores measure coding problems, not the reliability or completion rate of long coding-agent tasks.
Benchmark sources
- The author’s Strata 0.1.26 benchmark notes and raw run data.
- Strata technical documentation.
- Local Swift tests used pinned model files. The author’s data did not include file SHA hashes, so byte-for-byte identity cannot be confirmed.
- The tester retains the nine-run raw outputs, prompts, settings and RAM measurement records. This article includes the summaries and individual new-version runs.



Discussion